(iii) Chemical reactions and equilibria - Part III
Applications to selected systems
NOTE: The symbol represents
the equilibrium sign,
.
Extraction of metals from their oxides - Ellingham diagrams
Metals can be obtained from their ores by reduction with carbon or carbon monoxide.
The reduction of the metal oxides MO to M occur if any of the following equilibria lies to the right, i.e. has K > 1, a condition which requires a negative DrG.

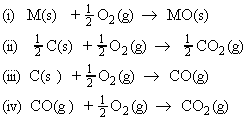
These equilibria are usually discussed in terms of the thermodynamics of the following four oxidation reactions:
that is, the Gibbs energy of the reactions for metal oxide reduction are related to the Gibbs energy of reactions i - iv above by:
A reduction will only occur if any of these three DrG are negative, that is,:
or:
(Note: This is equivalent to saying that successful reduction of the oxide depends on the outcome of the competition of the carbon for the oxygen bound to the metal.)
We have already noted in that the Gibbs energy of a reaction varies with temperature. In fact, the temperature dependence of these oxidation reactions (i) to (iv) depend on the reaction entropy through:
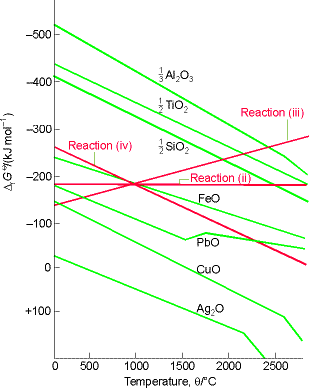
The variation of DrG with temperature for metal oxidation reactions (i.e. for reactions i - iv) and are represented graphically through an Ellingham diagram. A typical Ellingham diagram is provided in Fig. 1. Note that it is conventional to plot the most negative values of DG on the upper part of the y-axis, that is, DG decreases upwards. This means, that from an Ellingham diagram we may deduce that a metal oxide will be reduced by any carbon reaction lying above it. Thus, deductions from the Ellingham diagram in Fig. 1 include:
- CuO can be reduced to Cu at any temperature above room temperature.
- Al2O3 is not reduced by carbon until the temperature has been raised to above 2300°C.
- Even in the absence of carbon, Ag2O decomposes when heated above 200°C because then the standard Gibbs energy for reaction (i) becomes positive (and the reverse reaction is then spontaneous).
Let us start with reactions (ii), (iii) and (iv). Because in reaction (iii) there is a net increase in the amount of gas, the standard reaction entropy is large and positive therefore, its DrG0decreases sharply with increasing temperature. In reaction (iv), there is a similar net decrease in the amount of gas, so DrG0increases sharply with increasing temperature. In reaction (ii), the amount of gas is constant, so the entropy change is small and DrG0changes only slightly with temperature.
We have already seen that the DrG0 is given by:
At room temperature, DrG0 is dominated by the contribution of the reaction enthalpy (TDrS0 being relatively small), so the order of increasing DrG0 is the same as the order of increasing DrH0 (the formation of Al2O3 is most exothermic, Ag2O is least). The standard reaction entropy is similar for all metals because in each case gaseous oxygen is eliminated and a compact, solid oxide is formed. As a result, the temperature dependence of the standard Gibbs energy oxidation should be similar for all metals, as is shown by the similar slopes of the lines in the Ellingham diagram. The kinks at high temperatures correspond to the boiling point of the metals. (Less pronounced kinks occur at the melting temperatures of the metals and the oxides).
Fig. 1: An Ellingham diagram for the discussion of metal ore reduction. Note that DrG0 is most negative at the top of the diagram.
NOTE: The symbol(a) Introductionrepresents the equilibrium sign,
.
Acids and bases are present in solution provides us with one of the most important examples of chemical equilibrium. The Bronsted-Lowry definitions of acids and bases states that: An acid is a proton donor; a base is a proton acceptor. These definitions make no mention of the solvent (and apply even if no solvent is present). However, in this discussion we shall assume the acids/bases are in aqueous solution, as is usually the case. An acid HA takes part in the following proton transfer equilibrium in water:
where A- is the conjugate base of the acid, and H3O+ is the hydronium ion, a representation of the state of the proton in aqueous solution. C_EQN 1
For aqueous solutions of acids and bases, we may define the pH:
At low concentrations, the activity of hydronium ions is approximately equal to their molality and molar concentration.
The equilibrium constant for C_EQN 1 is given by:
which for dilute solutions, the activity of water is close to 1 (the value for pure water). Under such condition, the equilibrium can be expressed in terms of the acidity constant, Ka :
which if we make the approximation of replacing the activities in acidity constants by the numerical values of the molar concentrations we obtain:
the so a determination of pH is an indication of hydronium ion concentration. However, many thermodynamic observables depend on pH itself, and there is no need to make this approximation and interpretation.
NOTE: The approximation aJ is approximately equal to [J] is legitimate only if all the ions are present at low concent not merely the ions of interest, because all ions contribute to the departures from ideality. (Concentrations must be very low for approximation to be permissible - even for a 10-3 M solution of a 1:1 electrolyte in water at 25 °C, the activity coefficients are about 0.96, and their neglect introduces an error or c.10 per cent into the interpretation of equilibrium constants.
It is common practice to report values of Ka in terms of its negative logarithm, pKa where as in the case of pH,
NOTE: (1) A high value of pKa signifies a very small value of Ka (Ka = 1/10pKa) and hence a very weak acid. (2) The use of pKa in place of Ka simplifies the appearance of a number of equations, a simplification which comes from the fact that Ka of the proton transfer equilibrium is related to the standard Gibbs energy of the reaction by:
since:
This means that manipulations of pKA are in fact
manipulations of DrG in disguise.
In analogy to all this, for a base B in water, the characteristic proton transfer equilibrium is:
 C_EQN 2
where HB+ is the conjugate acid of the base B. As for
acids we cab define Kb the basicity constant by:
Another common practice is to express proton transfer equilibria involving a base in terms of its conjugate acid:
 C_EQN3
If we multiply the expressions for Ka and Kb
we obtain:
where Kw is the autoprotolysis constant of water:
At 25oC, Kw = 1.008 x 10⁻¹⁴
(pKw = 14.00), showing that only a few of the molecules
are ionized. If we introduce pOH, by analogy with pH defined as:
we obtain:
Also, because the molar concentrations of H3O+
and OH- are equal in pure water, it follows that, for pure water
at 25°C,
Strong acids/bases
For a strong acid (one that is fully ionized in solution), the molar concentration of hydronium ions is the same as the nominal molar concentration (i.e. the molar concentration of the solute as prepared ignoring any proton transfer) of the acid, as each HA molecule generates one hydronium ion.
For strong bases, the pH is calculated from the pOH, bearing in mind that for a Group 1 hydroxide of formula MOH in solution, the molar concentration of hydroxide ions is the same as the nominal molar concentration of the base, as each B molecule generates one OH ion, whilst for Group 2 hydroxides, of formula M(OH)2, the OH- concentration is twice the nominal molar concentration of the base.
Weak acids/bases
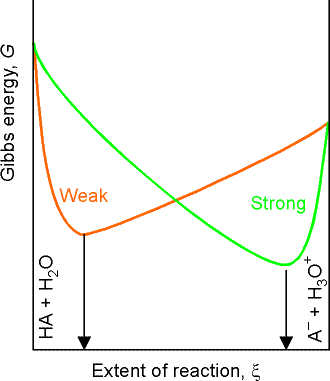
For a weak acid or base, we need to take the partial ionization into account by considering the proton transfer equilibrium The distinction between weak and strong acids and bases is that strong acids and bases are those for which the minimum Gibbs energy of the solution lies close to the (ionized) products, weak acids and bases are those for which the minimum lies close to the (non-ionized) reactants (see fig. 2). However, because the extent of ionization is so small (for typical solutions), an approximation is that the molar concentration of HA or B is unchanged from its nominal value. Moreover, because the molar concentrations of the species produced by the proton transfer are equal (to a good approximation), the expression for Ka simplifies to:
i.e.:

Note that:
- At the stoichiometric point (previously called equivalence point) of a titration of a weak acid (such as acetic acid, CH3OOH) and strong base (NaOH), the analyte (the solution being titrated) has become an aqueous solution of the weak acid-strong base salt (sodium acetate). At this point, the solution contains CH3OO- and Na+ ions together with any ions stemming from autoprotolysis. The presence of the Bronsted base CH3OO- means that we can expect a pH of greater than 7.
- At the stoichiometric point of a titration of a weak base (such as ammonia solution, NH3(aq)) and a strong acid (HCl), the analyte is a solution of a strong acid-weak base salt (ammonium chloride) and contains NH4+ and Cl- ions. Because Cl- is a negligibly weak Bronsted base and NH4+ is a weak Bronsted acid, the solution is acidic and its pH will be less than 7.
We shall suppose that we are titrating a volume VA solution of a weak acid of nominal molar concentration A0 (the analyte) with a solution of a strong base MOH of molar concentration B (the titrant) When a volume VB of the titrant has been added to the analyte the total volume of the analyte is V = VA + VB .
The approximations we shall make are based on the fact:
- That the acid is weak, therefore that HA is more abundant than any A- ions in the solution.
- When HA is present, it provides hydromum ions that greatly outnumber any that stem from autoprotolysis of water.
- When excess base is present, the OH- ions it provides dominate any that come from the water autoprotolysis.
 ['weak acid alone' formula]
NOTE: The corresponding expression for a solution of a weak base
is:
After the addition of some base (but before the stoichiometric point
is reached), the concentration of A ions stems almost entirely
from the salt that is present, for the weak acid present provides only
a few A ions Therefore, [A-] = S, the
molar concentration of the salt (the base). The amount of HA molecules
that remains is the original amount, A0V0
less the amount of HA molecules that have been converted to salt by the
addition of base. Thus the molar concentration of HA is:
This calculation ignores the small additional loss of HA as a result of its ionization in solution. Hence, by making the doubtful approximation that the activity coefficient of the A- ions is close to 1, we have:
i.e.:
 [Henderson-Hasselbalch equation]
This expression is called the Henderson-Hasselbalch equation,
the general form of which is (recognizing that A' is the molar concentration
of acid in the solution, and S is the molar concentration of base):
 [Henderson-Hasselbalch equation]
Note that when the molar concentrations of acid and salt (acting
as the base) are equal,
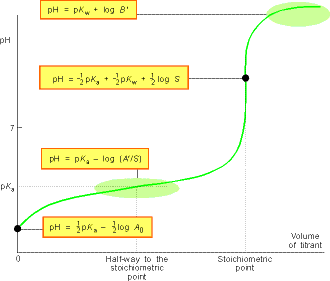
pH = pKaThis means that pKa of the acid can be measured directly from the pH of the mixture. In practice this is done by recording the pH during a titration and then examining the record for the pH halfway to the stoichiometric point (see fig. 3).
At the stoichiometric point, the hydronium ions in the solution stem from the influence of the OH- ions on the autoprotolysis equilibrium and the OH- ions are produced by the proton transfer equilibrium from H2O to A- . Because only a small amount of HA is formed in this way, the concentration of A ions is almost exactly that of the salt, and we can write:
The number of OH ions that arise from the proton transfer equilibrium greatly outnumber those produced by the water autoprotolysis, so we can set:
and thus:
i.e.:
i.e. by taking negative logarithms of both sides, and recalling that pH = pKw - pOH, we get:
 ['salt alone' formula]
NOTE: The corresponding expression for the pH at the stoichiometric
point of a titration of a strong acid with a weak base is:
 ['salt alone' formula]
When so much strong base has been added that the titration has been
carried well past the stoichiometric point, the pH is determined by the
excess base present. Then:
or we write the molar concentration of excess base as B':
 ['excess' formula]
NOTE: In this expression, as in all the preceding ones, the molar
concentrations must take account the change of volume that occurs as the
titrant is added to the analyte.
The general form of the pH curve throughout a titration is illustrated
in Fig. 3.

Fig. 3: A summary of the regions of the pH curve of the titration
of a weak acid with a strong base - Note that the pH rises slowly from
the value given by the 'weak acid alone' formula following the values given
by the Henderson-Hasselbalch equation until the stoichiometric point is
approached. It then changes rapidly to and through the value given by the
'salt alone' formula. It then climbs less rapidly towards the value given
by the 'excess' formula. The stoichiometric point can be detected easily
by observing where the pH changes rapidly through the value given by the
'salt alone' formula.
The slow variation of the pH in the vicinity of S = A', when the molar concentration salt and acid are equal, is the basis of buffer action, the ability of a solution to oppose changes in pH when small amounts of strong acids and bases are added to the solution. The mathematical basis of buffer action is the logarithmic dependence given by the Henderson-Hasselbalch equation, which is quite flat near pH = pKa . The physical basis for buffer action is that the existence of an abundant supply of A- ions (because a salt is present) can remove most of the hydronium ions brought by additional strong acid; moreover, the numerous HA molecules can supply the hydronium ions to react with any strong base that is added.
(e) Acid-base indicators
The rapid change of pH near the stoichiometric point in a titration is the basis of indicator detection. An acid-base indicator is normally some large, water-soluble, weakly acidic organic molecule which can exist as acid (HIn) or conjugate base (ln-) forms that differ in colour. The two forms are in equilibrium in solution:
and, if we make the usual assumption that the solution is so dilute that the activity of water is 1, then the equilibrium is described by the constant:
i.e. the ratio of [HIn] / [In-] is given by:
Therefore, when the pH is less than pKIn, the indicator is predominantly in its acidic form and has colour 1, when the pH is greater than pKIn, the indicator is mainly in its basic form and has colour 2. The end point is the pH of the solution when both forms are present in equal abundance, which occurs when pH = pKIn.
At the stoichiometric point of an acid-base titration, the pH changes sharply through several units and, if the pH passes through pKIn, there is a pronounced colour change. With a well-chosen indicator, the end point coincides with the stoichiometric point of the titration.
Care must be taken to use an indicator that changes colour at the pH appropriate to the type of titration. Thus, in a weak acid-strong base titration, the stoichiometric point lies at the pH given by:
so an indicator that changes at that pH must be selected. Broadly speaking, an indicator with pKIn > 7 is required because the stoichiometric point lies at pH>7.
Similarly, in a strong acid-weak base titration, an indicator changing near the pH given by:
should be used. The stoichiometric points of such titrations lie at pH < 7, so an indicator with pKIn <7 is required.


