| |
BACK
TO TABLE OF CONTENTS
A theoretical investigation of chemical
kinetics - (v)
Potential energy surfaces
(1) Introduction
(2) Some results from experiments and calculations
(2-1) The direction
of attack and separation
(2-2) Attractive
and repulsive surfaces
(2-3) Classical
trajectories (i.e. trajectories obtained through equations of classical
mechanics)
Potential energy surfaces
(1) Introduction
The potential energy surface of a reaction may be defined as
'the potential energy as a function of the relative positions of all
the atoms taking part in the reaction'.
For example, a collision between a hydrogen atom (H) and a hydrogen
molecule (H2), the potential energy surface is the plot of the
potential energy for all relative locations of the three hydrogen nuclei.
Detailed calculations show that the approach of an atom along the H-H axis
requires less energy for reaction than any other approach, so initially
we confine our attention to a collinear approach where a hydrogen atom
HA approaches an HB-HC molecule in the
direction of HB-HC, heading towards HB.
Two parameters are required to define the nuclear separations:
-
The HA-HB separation, RAB, (= infinite
at the start of the of the encounter, equilibrium bond length at the end
of a successful of the encounter)
-
The HB-HC separation, RBC, (= equilibrium
bond length at the start of the of the encounter, infinite at the end of
a successful encounter.)
as illustrated in Fig. 1 below.
Fig. 1: The definition of RAB and RBC.
The total energy of the three-atom system depends on their relative
separations, and can be found through molecular modelling techniques (e.g.
by doing a molecular orbital calculations). The plot of the total energy
of the system against RAB and
RBC is
the potential energy surface of this collinear reaction, and is illustrated
in Fig. 2a below.
Note that:
-
This surface is normally depicted as a contour diagram, as illustrated
in Fig. 2b.
-
When RAB is very large, the variation in potential energy
represented by the surface is that of an isolated H2 molecule
as its bond length is altered, as illustrated in Fig. 2c. Similarly for
when RBC is very large at the end of a successful encounter.
Fig. 2 (a) The potential energy surface for the
H + H2 -> H2 + H reaction when the atoms are constrained
to be collinear.
Fig. 2(b) The contour diagram (with contours of
equal potential energy) corresponding to the surface in Fig. 2(a). Re
marks the equilibrium bond length of an H2 molecule (strictly,
it relates to the arrangement when the third atom is at infinity).
Fig. 2(c) The molecular potential energy curve
for the hydrogen molecule showing the variation of the energy of the molecule
as the bond length is changed. Re marks the equilibrium bond
length of an H2 molecule.
The paths that are available to the atoms may be deduced from the shape
of the potential energy surface, as these corresponds to paths of least
potential energy. (The actual path of the atoms in the course of the encounter
depends on their total energy, the sum of their kinetic and potential energies.)
Let us illustrate this for the simple case of a hydrogen atom HA
is approaching a hydrogen molecule, HB-HC, to form
HA-HB and HC. Referring to fig. 3a, let
us investigate three way how this (at least theoretically) can be accomplished:
(Path A): One approach could be to let the HB-HC
bond length remain constant during the initial approach of HA.
In this path, the potential energy rises to a high value as HA
is pushed into the molecule, and then decreases sharply as HC
breaks off and separates to a great distance.
(PATH B): An alternative reaction path can be imagined in which
the HB-HC bond length increases at an early stage
of the approach of HA (i.e. while HA is still far
away). This path takes the system through a region of a high potential
energy in the course of the encounter (compare with path C).
(PATH C): This is the path of least potential energy, and corresponds
to RBC lengthening as HA approaches and begins
to form a bond with HB. The HB-HC bond
relaxes at the demand of the incoming atom, and the potential energy climbs
only as far as the saddle-shaped region of the surface, to the saddle
point marked C. In this path of least potential
energy, the atoms take a route up the floor of the valley, through the
saddle point, and down the floor of the other valley as HC recedes
and the new HA-HB bond achieves its equilibrium length.
This path is the reaction coordinate we met in the earlier section discussing
the activated complex.
Thus, through Path C, we can now make contact with the activated complex
theory of reaction rates. In terms of trajectories on potential surfaces,
the transition state can be identified with a critical geometry such that
every trajectory that goes through this geometry goes on to react, i.e.
the saddle point C.
NOTE: Paths A and B are theoretically feasible, provided, the molecules
have sufficient initial kinetic energy to take the three atoms past the
regions of high potential energy in the course of the encounter.
Fig. 3a: Various trajectories through the potential
energy surface shown in Fig. 2. Path A corresponds to a route in which
RBC is held constant as HA approaches; path B corresponds to a route in
which RBC lengthens at an early stage during the approach of HA; path C
is the route along the floor of the potential valley.
Fig. 3b: The transition state is a set of configurations
(here, marked by the line across the saddle point) through which successful
reactive trajectories must pass.
(2) Some results from experiments and calculations
To travel successfully from reactants to products the incoming molecules
must possess enough kinetic energy to be able to climb to the saddle point
of the potential surface.
The shape of the surface can be explored experimentally by changing:
-
The relative speed of approach (by selecting the beam velocity), and,
-
The degree of vibrational excitation
and observing whether reaction occurs and whether the products emerge in
a vibrationally excited state.
Such work allows us to answer some important questions: For example,
what is better, to smash the reactants together with a lot of translational
kinetic energy or to ensure instead that they approach in highly excited
vibrational states? (In other words, is trajectory Fig. 4c, where the HBHC
molecule is initially vibrationally excited, more efficient at leading
to reaction than the trajectory in Fig. 4a, in which the total energy is
the same but has a high translational kinetic energy?)
Fig.. 4: An illustration of some successful (marked with an *) and
unsuccessful encounters: (a) C1* corresponds
to the path along the foot of the valley; (b) C2* corresponds
to an approach of HA to a vibrating HBC molecule,
and the formation of a vibrating HAB molecule as HC
departs. (c) C3 corresponds to HA approaching a non-vibrating
HBC molecule, but with insufficient translational kinetic energy;
(d) C4 corresponds to HA approaching a vibrating
HBC molecule, but still the energy, and the phase of the vibration,
is insufficient for reaction.
(2-1) The direction of attack and separation
(i) Direction of attack:
-
Fig. 5a shows the results of a calculation of the potential energy as an
H atom approaches an H2 molecule from different angles, the
H2 bond being allowed to relax to the optimum length in each
case. The potential barrier is least for collinear attack, as we assumed
earlier. (But we must be aware that other lines of attack are feasible
and contribute to the overall rate.)
-
In contrast, Fig. 5b shows the potential energy changes that occur as a
Cl atom approaches an HI molecule. The lowest barrier occurs for approaches
within a cone of half-angle 30o surrounding the H atom. The
relevance of this result to the calculation of the steric factor of collision
theory should be noted: not every collision is successful, because not
every one lies within the reactive cone.
 Fig. 5a: An indication of the anisotropy of the
potential energy changes as H approaches H2 with different angles
of attack. The collinear attack has the
lowest potential barrier to reaction. The surface indicates the potential
energy profile along the reaction coordinate for each configuration.
Fig. 5a: An indication of the anisotropy of the
potential energy changes as H approaches H2 with different angles
of attack. The collinear attack has the
lowest potential barrier to reaction. The surface indicates the potential
energy profile along the reaction coordinate for each configuration.
Fig. 5b: The potential energy barrier for the
approach of Cl to HI. In this case, successful encounters occur only when
Cl approaches within a cone surrounding the H atom.
(ii) Direction of separation:
-
If the collision is sticky, so that when the reactants collide they orbit
around each other the products can be expected to emerge in random directions
because all memory of the approach direction has been lost.
-
A rotation takes about 1 ps, so if the collision is over in less than that
time, the complex will not have had time to rotate and the products will
be thrown off in a specific direction.
For example, in the collision of K and I2, most of the products
are thrown off in the forward direction. This product distribution is consistent
with the harpoon mechanism because the transition takes place at long range.
In contrast, the collision of K with Cl2 leads to reaction only
if the molecules approach each other very closely. In this mechanism, K
effectively bumps into a brick wall, and the KI product bounces out in
the backward direction. The detection of this anisotropy in the angular
distribution of products gives an indication of the distance and orientation
of approach needed for reaction, as well as showing that the event is complete
in less than 1 ps.
(2-2) Attractive and repulsive surfaces
Some reactions are very sensitive to whether the energy has been predigested
into a vibrational mode or left as the relative translational kinetic energy
of the colliding molecules. For example:
-
If two HI molecules are hurled together with more than twice the activation
energy of the reaction, then no reaction occurs if all the energy is translational.
-
For F + HC1 -> Cl + HF, the reaction is about five times as efficient when
the HCl is in its first vibrational excited state than when, although HCl
has the same total energy, it is in its vibrational ground state.
The origin of these requirements can be found by examining the potential
energy surface: Figure 6a shows an attractive surface in which the
saddle point occurs early in the reaction coordinate. Figure 6b shows a
repulsive
surface in which the saddle point occurs late. A surface that is attractive
in one direction is repulsive in the reverse direction.
Fig.6a: An attractive potential energy surface.
A successful encounter (C*) involves high translational kinetic energy
and results in a vibrationally excited product.
Fig. 6b: A repulsive potential energy surface.
A successful encounter (C*) involves initial vibrational excitation and
the products have high translational kinetic energy. A reaction that is
attractive in one direction is repulsive in the reverse direction.
(i) The attractive surface (Fig. 6a)
-
Observations:
-
If the original molecule is vibrationally excited, then a collision with
an incoming molecule takes the system along C. This path is bottled up
in the region of the reactants, and does not take the system to the saddle
point.
-
If, however, the same amount of energy is present solely as translational
kinetic energy, then the system moves along C* and travels smoothly over
the saddle point into products.
-
Conclusions:
-
Reactions with attractive potential energy surfaces proceed more efficiently
the energy is in relative translational motion.
-
Moreover, the potential surface shows that once past the saddle point the
trajectory runs up the steep wall of the product valley, a then rolls from
side to side as it falls to the foot of the valley as the products separate.
In other words, the products emerge in a vibrationally excited state.
(ii) The repulsive surface (Fig. 6b).
-
Observations:
-
On trajectory C, the collisional energy is largely translational. As the
reactants approach, the potential energy rises. Their path takes them up
the opposing face of the valley, and they are reflected back into the reactant
region. This path corresponds to an unsuccessful encounter, even though
tl energy is sufficient for reaction.
-
On C* some of the energy is in the vibration of the reactant molecule and
the motion causes the trajectory to weave from side to side i the valley
as it approaches the saddle point. This motion may be sufficient to tip
the system round the corner to the saddle point and then on to products.
In this case, the product molecule is expected to be in an unexcited vibrational
state.
-
Conclusions:
-
Reactions wit repulsive potential surfaces can therefore be expected to
proceed more efficiently if the excess energy is present as vibrations.
(2-3) Classical trajectories (i.e. trajectories obtained through
equations of classical mechanics)
A clear picture of the reaction event can be obtained using classical
mechanics to calculate the trajectories of the atoms taking place in a
reaction.
-
Fig. 7a shows the result of such a calculation of the positions of the
three atoms in the reaction H + H2 -> H2 +H, the
horizontal coordinate now being time and the vertical coordinate the separations.
This illustration shows clearly the vibration of the original molecule
and the approach of the attacking atom. The reaction itself, the switch
of partners, takes place very rapidly and is an example of a direct-mode
process. The newly formed molecule shakes, but quickly settles down to
steady, harmonic vibration as the expelled atom departs.
-
In contrast, Fig. 7b shows an example of a complex-mode process, in which
the activated complex survives for an extended period. The reaction in
the illustration is the exchange reaction KCl + NaBr -> KBr + NaCl. The
tetraatomic
activated complex survives for about 5ps, during which time the atoms make
about 15 oscillations before dissociating into products.
Although this kind of calculation gives a good sense of what happens during
a reaction, its limitations must be kept in mind.
-
In the first place, a real gas-phase reaction occurs with a wide variety
of different speeds and angles of attack.
-
In the second place, the motion of the atoms, electrons, and nuclei is
governed by quantum mechanics. The concept of trajectory then fades and
is replaced by the unfolding of a wavefunction that represents initially
the reactants and finally the products.
Nevertheless, recognition of these limitations should not be allowed to
obscure the fact that recent advances in molecular reaction dynamics have
given us a first glimpse of the processes going on at the core of reactions.
Also, one is to note that such studies are now extermely feasable using
very basic computer software and hardware (see CH407).
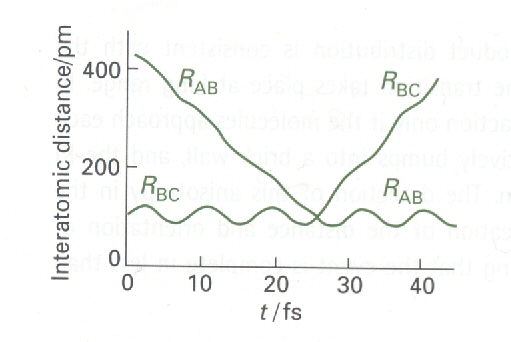
Fig. 7a: The calculated trajectories for a reactive encounter
between HA and a vibrating HBHC molecule
leading to the formation of a vibrating HAHB molecule.
This direct-mode raection is between H and H2 (M. Karplus et
al., J. Chem. Phys., 43 (1965) p.3258)
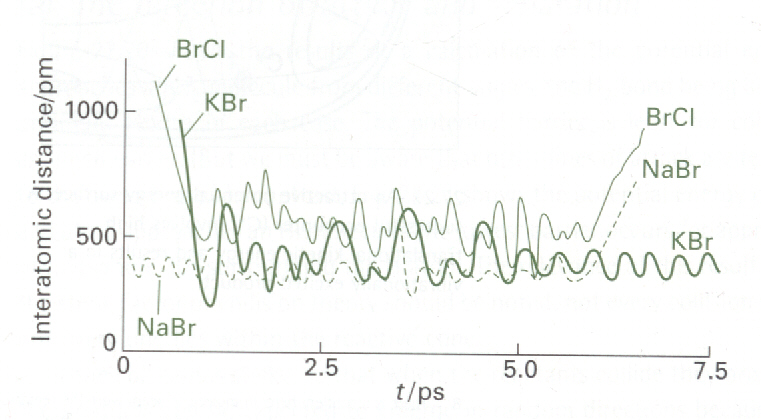
Fig. 7b: An example of the trajectories calculated for a complex-mode raection,
KCl + NaBr -> KBr + NaCl in which the collision cluster has a long lifetime.
(P. Brumer and M. Karplus, Faraday Disc. Chem. Soc., 55 (1973)
p.80).
BACK
TO TABLE OF CONTENTS
|
